01
Facilities and operations
Identify outages, abnormal current and energy patterns without waiting for a bill or a site visit.
Monitor electricity consumption, solar generation, grid import and export, current and site health from one clean Australian platform. Review 15-minute history, manage users and receive practical alerts before small issues become expensive ones.
A practical interface for administrators, facilities teams, electrical contractors, energy managers and business owners — from a single shopfront to a national portfolio.
Identify outages, abnormal current and energy patterns without waiting for a bill or a site visit.
View site status, compare locations and maintain consistent access across an expanding portfolio.
Understand generation, on-site use and export so you can see how the system is performing.
Use live and historical data to investigate faults, validate changes and support informed recommendations.
Fast enough for daily operations, structured enough for portfolio management and clear enough for the people who need to act on it.
Dynamic cards display grid import, export, solar generation, site load, current and active alerts. Online and offline indicators make site health immediately clear.
See how it works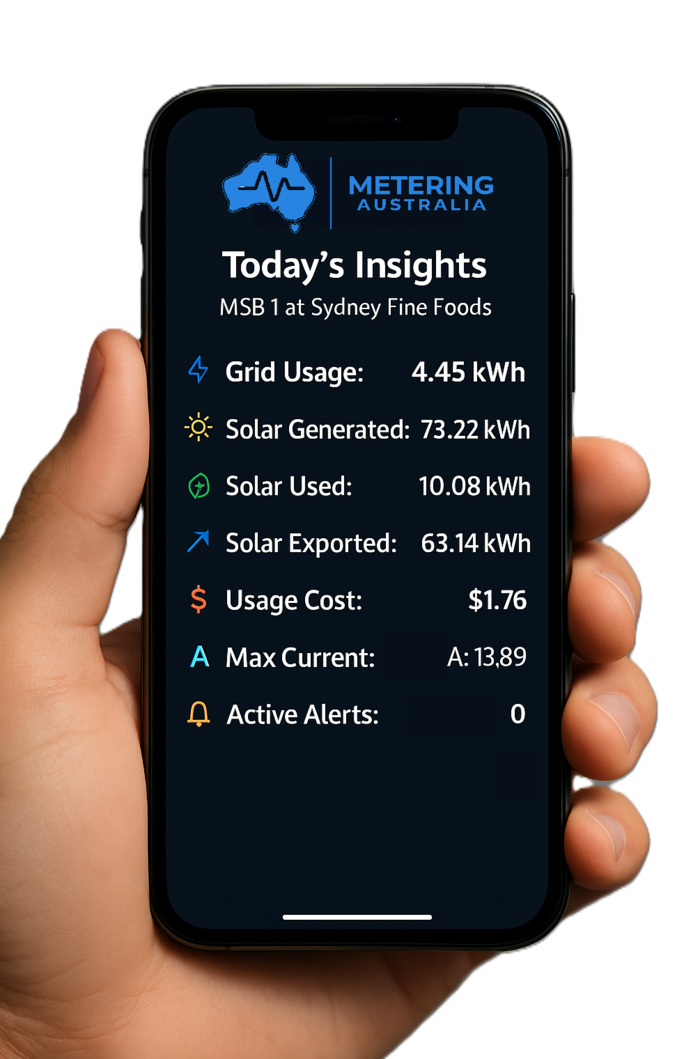
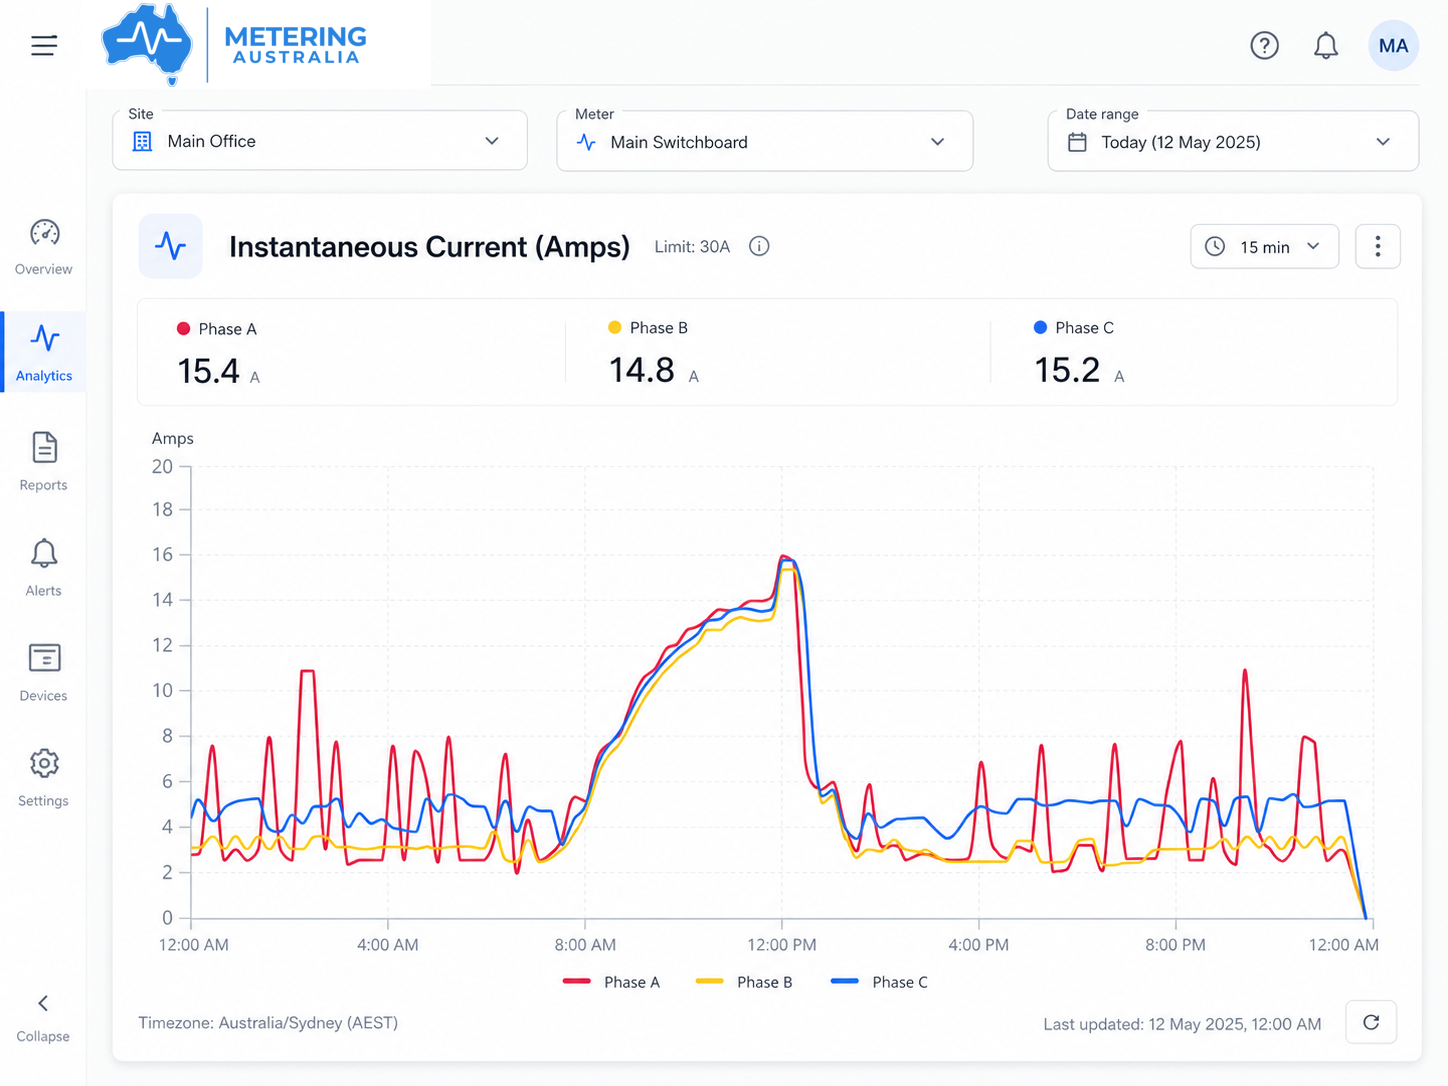
Review interactive day, week and month views with precise tooltips and selectable ranges. Export data or capture charts for internal reporting.
See how it works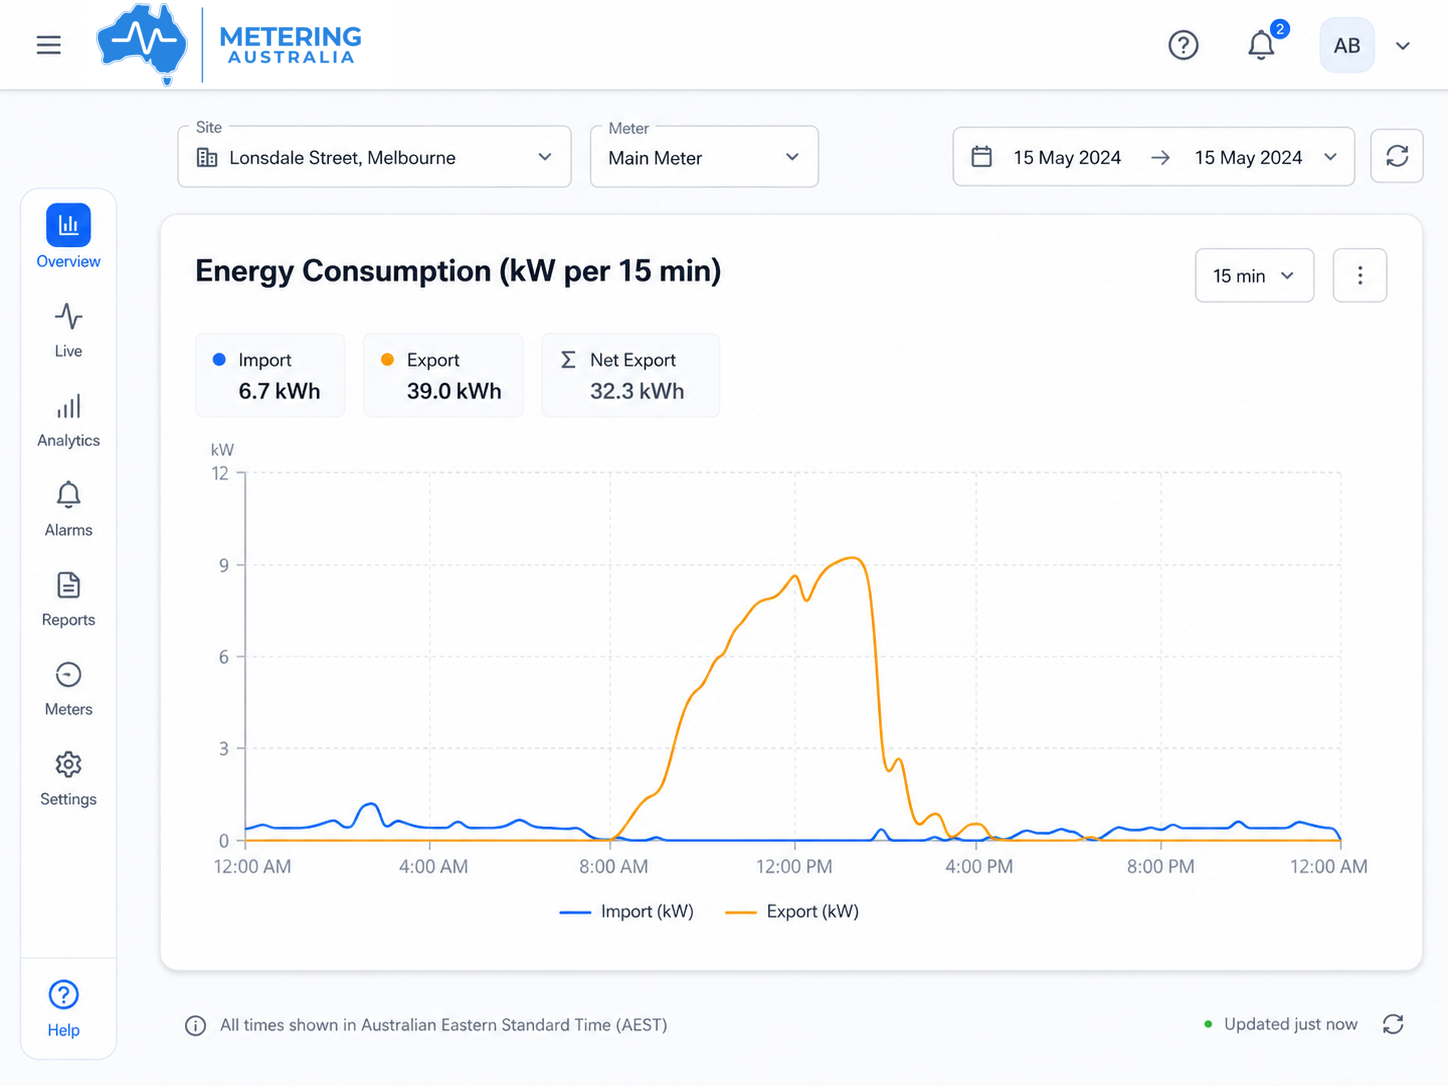
Use a satellite-hybrid map with live status markers across Australia. Select a site marker to open its operational details.
See how it worksReceive offline, restored and overcurrent notifications. Acknowledge events and review a clear audit trail by site, severity and status.
See how it worksOvercurrent · Phase AWestern Sydney DC · 4 minutes ago
CriticalCommunications restoredNewcastle Workshop · 18 minutes ago
ResolvedMeter offlineCanberra Office · 42 minutes ago
OpenAssign Global Admin, Site Admin and User roles with precise meter and site access, including SMS notification preferences.
See how it worksSecure API-key authentication supports controlled system integration, while per-site activation and expiry controls keep account management clear.
See how it worksGET /v1/sites/portfolio/live
{
"site": "Sydney Fine Foods",
"status": "online",
"grid_import_kw": 4.45,
"solar_generation_kw": 73.22,
"active_alerts": 0
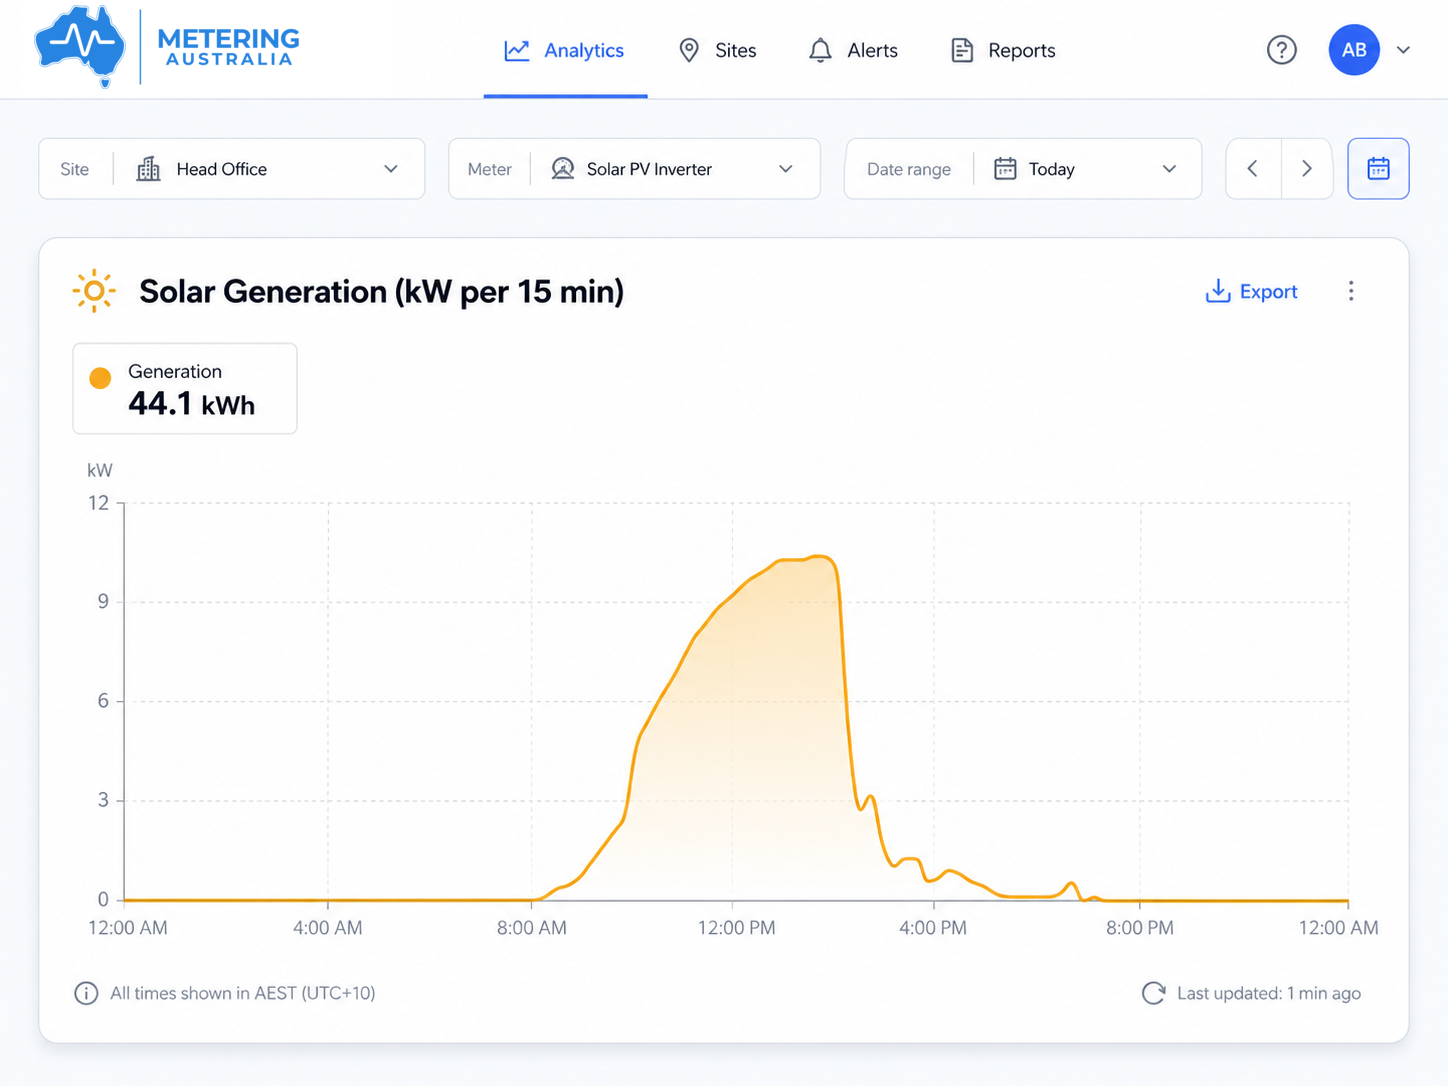
}See when energy is being used, what solar is producing, whether current is approaching a threshold and how performance changes across the selected period.
OvercurrentWestern Sydney DC
NowMeter offlineCanberra Office
12mSite restoredNewcastle Workshop
38mConfigure alerts around the conditions your team needs to know about, then keep the event history organised and accountable.
Offline and restoredReceive SMS or email when a site drops offline or returns, with outage duration tracking.
OvercurrentSet per-phase thresholds for mains and solar strings, with adjustable hold-off periods to reduce nuisance alerts.
AcknowledgementsAcknowledge an event in one click and retain an audit trail for later review.
Quiet hoursSuppress non-critical notifications overnight or apply windows to individual sites.
We confirm the switchboard, loads, solar arrangement, communications and reporting goals.
Hardware requirements and installation costs are quoted for the actual site conditions.
Meters are assigned to the correct site, account and users with access configured for your team.
Use live data, history, maps and alerts to support day-to-day operational decisions.
Platform access is priced per site, per month and per meter. Hardware, installation and site works are quoted separately for the actual installation.
View full pricingper site / month / meter
per site / month / meter
Need to confirm something specific about your sites or metering arrangement? Send it through and we will respond within one business day.
Ask a questionIn Australia, on secure infrastructure. You can export your data at any time.
Current plans include data retention from two to five years. Longer retention can be discussed for enterprise requirements.
Software pricing is shown on the pricing page. Hardware and installation costs depend on the switchboard, metering arrangement, communications and site conditions, so these are quoted separately.
Single sign-on is available for Enterprise customers.
You do. Metering Australia hosts and processes the data so authorised users can visualise, alert on and export it.
Tell us what you are monitoring and we will focus the demonstration on your sites, users, solar and alert requirements.